Statistics Class Exercises for the CMS Data Analysis School 2018 (Pisa)
- Statistics Class Exercises for the CMS Data Analysis School 2018 (Pisa)
- Summary
- Reference materials
- Computing environment
- Exercise #0: Fit a lower statistics data sample using RooFit
- Exercise #1: compute the excess significance
- Exercise #2: compute upper limits to the signal yield using frequentist and Bayesian methods
- Exercise #3: measure the cross section with full statistics
The goal of the exercise is to get acquainted with few of the statistical analysis practices used in HEP. Introductory slides will present a general refresher on statistics, as well as the main features of RooFit and RooStats, and will give some additional information on the hands-on session.
This exercises use the CMS public data from the 2010 proton-proton running. In particular, the invariant mass spectrum of muon pairs from data is provided. The purpose of the session is to approach the discovery of a "new" particle in the context of the observation of the ψ(2S) resonance in the CMS data. No specific knowledge of the CMS apparatus is needed. This is what the distribution of the dimuon invariant mass spectrum looks like for about 2% of the total 2010 statistics:
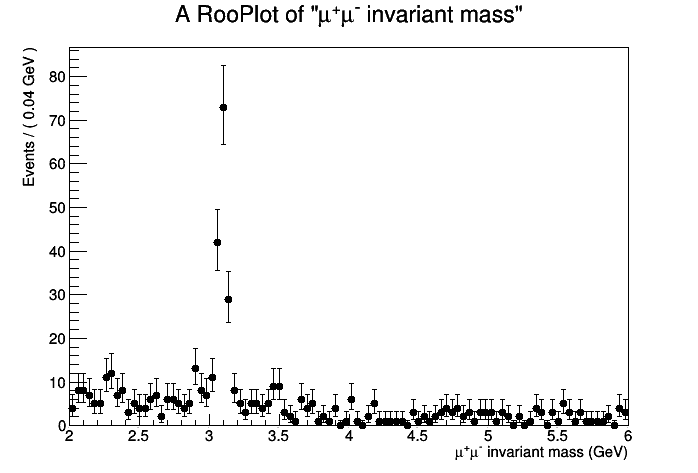
The J/ψ is of course very visible around the 3.1 GeV mass point. We expect to see an excess around 3.65 GeV for the ψ(2S). Is it there? Let's investigate!
Do notice that usually experiments do not proceed in this way towards a discovery. In general, blind analyses are performed and the methodology and modelization for data interpretation is decided before looking at the actual data. For the purpose of describing the statistical tools in this lecture, we will neglect these considerations for now.
Summary
The exercise session introduces methods and tools for tackling very common problems in statistics while complying with rigorous standards set in today's experimental particle physics. The main topics are finding a confidence interval for a parameter of interest, and estimating the statistical significance of an excess of events with respect to the background expectations. We cover the most popular techniques: profile likelihood, Bayesian. Participants will learn the main features of the RooFit and RooStats software frameworks for statistics and data modeling. We overview the popular cases of a hunting a signal peak over a predictable falling background.
Reference materials
- Statistics in Theory
 - a lecture by Bob Cousins
- Statistical methods in LHC data analysis - Luca Lista
- RooFit reference slides - by Wouter Verkerke, one of RooFit authors
- RooFit tutorials - a set of working macros that showcase all major features of RooFit
- RooStats Manual - concise, contains clear summary of statistics concepts and definitions
- RooStats tutorial - by Kyle Cranmer, one of the RooStats developers
- RooStats tutorials - a set of working macros that showcase all major features of RooStats
Computing environment
All exercises should run on any ROOT installation containing also the RooFit libraries (RooStats is included in the RooFit installation). On your laptop you obtain this by passing the --enable-roofit on the configure step of the ROOT installation. If you have a debian based installation, you just need to install the libRooFit library. All the code here uses PyROOT, which is a python interface to ROOT libraries, so a python installation is also required.
Alternatively, if you have a CERN account, most of the central ROOT installations contain RooFit.
PyROOT programs can be ran using the following command from the shell prompt:
python macro.py
In order to have all ROOT libraries available in PyROOT, the following line should be added at the begin of every program (macro.py, in the previous command line example):
import ROOT
Exercise #0: Fit a lower statistics data sample using RooFit
First of all, you will need a copy of the data ROOT file containing the invariant mass information from dimuon events. We will start with a data sample which corresponds to about 20% of the statistics available on 2010:
wget http://pellicci.web.cern.ch/pellicci/DataSet_lowstat.root
Let's create a skeleton for a PyROOT program. Let's call it, for instance, exercise_0.py, and load the ROOT libraries:
#Import the ROOT libraries
import ROOT
- Open the ROOT file containing the data, and extract the RooDataSet object. A RooDataSet is essentially an ntuple (similar to a TTree in simple ROOT) containing your N-dimensional observables (in this case it has one dimension, it contains the dimuon invariant mass measurement for the selected events):
fInput = ROOT.TFile("DataSet_lowstat.root")
dataset = fInput.Get("data")
- Define the observables of the problem. In our case, this is a
one-dimensional problem, and the observable is the invariant mass of the
dimuon system. To handle this, RooFit uses the class RooRealVar.
Note that at the constructor you have several options. In the
following, either a range will be specified, or an initial value plus a
range.
#The observable
mass = ROOT.RooRealVar("mass","#mu^{+}#mu^{-} invariant mass",2.,6.,"GeV")
- Modelization of the observable distribution. Let's start from the
most striking feature: the J/ψ peak. We will describe this signal using a
Crystal Ball function (see Wikipedia),
which is essentially a Gaussian core with a polynomial left tail to
account for energy losses. First, we have to define the parameters of
the function.
#The Jpsi signal parametrization: we'll use a Crystal Ball
meanJpsi = ROOT.RooRealVar("meanJpsi","The mean of the Jpsi Gaussian",3.1,2.8,3.2)
sigmaJpsi = ROOT.RooRealVar("sigmaJpsi","The width of the Jpsi Gaussian",0.3,0.0001,1.)
alphaJpsi = ROOT.RooRealVar("alphaJpsi","The alpha of the Jpsi Gaussian",1.5,-5.,5.)
nJpsi = ROOT.RooRealVar("nJpsi","The alpha of the Jpsi Gaussian",1.5,0.5,5.)
- Define a PDF for the signal model. The Crystal Ball distribution, in this case, is provided by the RooCBshape class:
CBJpsi = ROOT.RooCBShape("CBJpsi","The Jpsi Crystall Ball",mass,meanJpsi,sigmaJpsi,alphaJpsi,nJpsi)
- Now we have to define a model for the excess around 3.65 GeV.
Since there aren't many events involved, the functional form to
describe this peak doesn't need to be very sophisticated. A simple
Gaussian function (described by RooGaussian)
is probably enough for the level of precision required. We are going to
do an assumption here: the resolution in the mass region of this excess
is probably similar to the dimuon resolution around the J/ψ mass peak.
Therefore, we will use the width of the Gaussian core of the J/ψ Crystal
Ball to describe the width of the Gaussian for this new excess. In this
way, we use the high statistics of the J/ψ peak to better constrain our
signal modelization
#The psi(2S) signal parametrization: width will be similar to Jpsi core of the CB (almost Gaussian)
meanpsi2S = ROOT.RooRealVar("meanpsi2S","The mean of the psi(2S) Gaussian",3.7,3.65,3.75)
gausspsi2S = ROOT.RooGaussian("gausspsi2S","The psi(2S) Gaussian",mass,meanpsi2S,sigmaJpsi)
- Now also define the background. A third order polynomial is enough here. We'll use Chebychev polynomials:
#Background parametrization: just a polynomial
a1 = ROOT.RooRealVar("a1","The a1 of background",-0.7,-2.,2.)
a2 = ROOT.RooRealVar("a2","The a2 of background",0.3,-2.,2.)
a3 = ROOT.RooRealVar("a3","The a3 of background",-0.03,-2.,2.)
backgroundPDF = ROOT.RooChebychev("backgroundPDF","The background PDF",mass,ROOT.RooArgList(a1,a2,a3))
- Now, define the yields for the different contributions to the spectrum, again using the RooRealVar class. Consider first the J/ψ and background yields:
#Define the yields
NJpsi = ROOT.RooRealVar("NJpsi","The Jpsi signal events",1500.,0.1,10000.)
Nbkg = ROOT.RooRealVar("Nbkg","The bkg events",5000.,0.1,50000.)
- For the ψ(2S), we can actually determine the cross section, instead of just the number of events. This is a simple transformation that gets us to the actual parameter of interest. A function of variables can be expressed in RooFit using the class RooFormulaVar:
#Now define the number of psi(2S) events as a product of crss section*efficiency*luminosity (in pb)
#Let's assume we measured the trigger, reconstruction and identification efficiency for dimuons and found it to be 95%
#Lowstat sample has 0.64 pb-1
#Fullstat sample has 37 pb-1
eff_psi = ROOT.RooRealVar("eff_psi","The psi efficiency",0.75,0.00001,1.)
lumi_psi  = ROOT.RooRealVar("lumi_psi","The CMS luminosity",0.64,0.00001,50.,"pb-1")
cross_psi = ROOT.RooRealVar("cross_psi","The psi xsec",3.,0.,40.,"pb")

#Now define the number of psi events
Npsi = ROOT.RooFormulaVar("Npsi","@0*@1*@2",ROOT.RooArgList(eff_psi,lumi_psi,cross_psi))

#Important! We cannot fit simultaneously the efficiency, the luminosity and the cross section (our total PDF is only sensitive on the product of the three)
#We need to fix two of them, so we'll keep our POI floating
#One can also add an additional PDF to give predictive power on the other two parameters (later)
eff_psi.setConstant(1)
lumi_psi.setConstant(1)
- The total PDF is a linear combination of the different components with weights that are proportional to NJpsi, Npsi and Nbkg. This is implemented in RooFit in the class RooAddPdf. Note that the lists of PDF and yields are passed via the RooArgList class:
#Compose the total PDF
totPDF = ROOT.RooAddPdf("totPDF","The total PDF",ROOT.RooArgList(CBJpsi,gausspsi2S,backgroundPDF),ROOT.RooArgList(NJpsi,Npsi,Nbkg))
- As we have the dataset ready, we can fit it to the PDF model in order to determine the desired parameters:
#Do the actual fit
totPDF.fitTo(dataset, ROOT.RooFit.Extended(1))

#Print values of the parameters (that now reflect fitted values and errors)
print "##############"
meanpsi2S.Print()
NJpsi.Print()
Npsi.Print()
print "##############"
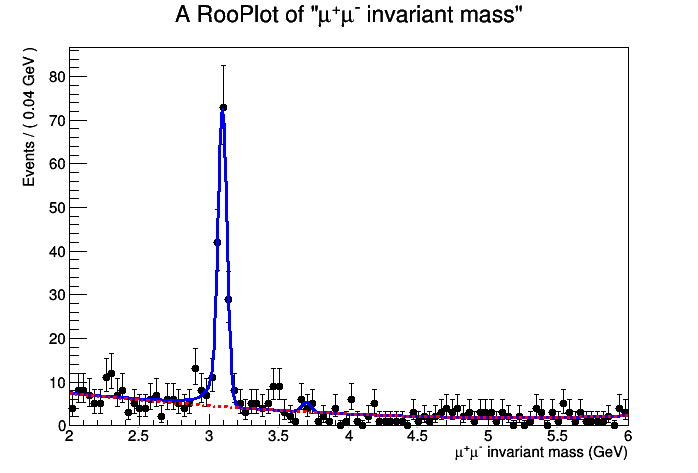
- The result of the fit is printed as usual Minuit output, but you
can also produce a plot of the fit PDF and its signal and background
components, separately. Note that you need to use the class RooPlot, you can't directly call the usual ROOT Draw() method for RooFit objects:
#Now plot the data and the fit result
xframe = mass.frame()
dataset.plotOn(xframe)
totPDF.plotOn(xframe)

#One can also plot the single components of the total PDF, like the background component
totPDF.plotOn(xframe, ROOT.RooFit.Components("backgroundPDF"), ROOT.RooFit.LineStyle(ROOT.kDashed), ROOT.RooFit.LineColor(ROOT.kRed))

#Draw the results
c1 = ROOT.TCanvas()
xframe.Draw()
c1.SaveAs("exercise_0.png")
- In order to make the PDF model and the dataset available for use in next exercises, you can save it into a RooWorkspace object that can be written directly into a ROOT file:
#Now save the data and the PDF into a Workspace, for later use for statistical analysis
ws = ROOT.RooWorkspace("ws")
getattr(ws,'import')(dataset)
getattr(ws,'import')(totPDF)

fOutput = ROOT.TFile("Workspace_mumufit.root","RECREATE")
ws.Write()
fOutput.Write()
fOutput.Close()
- Now execute the python program. The result should look like the following:
The entire exercise is available below:
Exercise #1: compute the excess significance
- First of all, create a skeleton python program and call it, for instance, exercise_1.py. Load ROOT:
import ROOT
- Import the workspace from the file produced in the previous exercise:
#Open the rootfile and get the workspace from the exercise_0
fInput = ROOT.TFile("Workspace_mumufit.root")
ws = fInput.Get("ws")

ws.Print()
- You can set as constant some of the parameters of the model. As an
example, we set the J/ψ mean of the Crystal Ball function. A parameter
that is constant is of course unchanged, for example, in a likelihood
scan. The more parameters are constant, the higher your statistical
sensitivity, but this is a strong statement: setting a parameter as
constant means that its uncertainty is negligible in this problem. Note
how you can access variables by name using the RooWorkspace class:
#You can set constant parameters that are known
#If you leave them floating, the fit procedure will determine their uncertainty
ws.var("meanJpsi").setConstant(1)
- RooStats needs to configure the PDF model using the class ModelConfig:
#Set the RooModelConfig and let it know what the content of the workspace is about
model = ROOT.RooStats.ModelConfig()
model.SetWorkspace(ws)
model.SetPdf("totPDF")
- Let's access the parameter cross_psi from the workspace and take a "snapshot" (i.e.: a clone). We want to set cross_psi=0 in order to determine the significance, measured from the p-value corresponding to the background-only hypothesis.
#Here we explicitly set the value of the parameters for the null hypothesis
#We want no signal contribution, so cross_psi = 0
cross_psi = ws.var("cross_psi")
poi = ROOT.RooArgSet(cross_psi)
nullParams = poi.snapshot()
nullParams.setRealValue("cross_psi",0.)
- We use the class ProfileLikelihoodCalculator to implement the profile-likelihood method and determine the significance with the class HypoTestResult:
#Build the profile likelihood calculator
plc = ROOT.RooStats.ProfileLikelihoodCalculator()

plc.SetData(ws.data("data"))
plc.SetModel(model)
plc.SetParameters(poi)
plc.SetNullParameters(nullParams)
- Now we just need to print out the result:
#We get a HypoTestResult out of the calculator, and we can query it.
htr = plc.GetHypoTest()

print "-------------------------------------------------"
print "The p-value for the null is ", htr.NullPValue()
print "Corresponding to a signifcance of ", htr.Significance()
print "-------------------------------------------------"

#PyROOT sometimes fails cleaning memory, this helps
del plc
Run this exercise. Is the peak aound 3.65 GeV significant?
The complete exercise is available below:
Exercise #2: compute upper limits to the signal yield using frequentist and Bayesian methods
- Create a new python file, call it, for instance, exercise_2.py, and load the ROOT libraries. Then, import the workspace created in exercise #0. Also, set a few parameters as constant. You would normally not do this, but otherwise the processing time for calculator becomes too long for this hands-on session:
import ROOT

#Open the rootfile and get the workspace from the exercise_0
fInput = ROOT.TFile("Workspace_mumufit.root")
ws = fInput.Get("ws")
ws.Print()

#You can set constant parameters that are known
#If you leave them floating, the fit procedure will determine their uncertainty
#Right now we will fix all the nuisance parameters just to speed up the computing time
ws.var("meanJpsi").setConstant(1)
ws.var("sigmaJpsi").setConstant(1)
ws.var("alphaJpsi").setConstant(1)
ws.var("nJpsi").setConstant(1)
ws.var("NJpsi").setConstant(1)
ws.var("meanpsi2S").setConstant(1)
ws.var("Nbkg").setConstant(1)
ws.var("a1").setConstant(1)
ws.var("a2").setConstant(1)
ws.var("a3").setConstant(1)
- Now we need to have two PDF models: one with both signal and
background, one with background only, which was the only model needed in
the previous exercise. Again, this is just to setup the proper ModelConfig for RooStats.
#Configure the model, we need both the S+B and the B only models
sbModel = ROOT.RooStats.ModelConfig()
sbModel.SetWorkspace(ws)
sbModel.SetPdf("totPDF")
sbModel.SetName("S+B Model")
poi = ROOT.RooArgSet(ws.var("cross_psi"))
poi.find("cross_psi").setRange(0.,40.)  #this is mostly for plotting
sbModel.SetParametersOfInterest(poi)

bModel = sbModel.Clone()
bModel.SetPdf("totPDF")
bModel.SetName( sbModel.GetName() + "_with_poi_0")
poi.find("cross_psi").setVal(0)
bModel.SetSnapshot(poi)
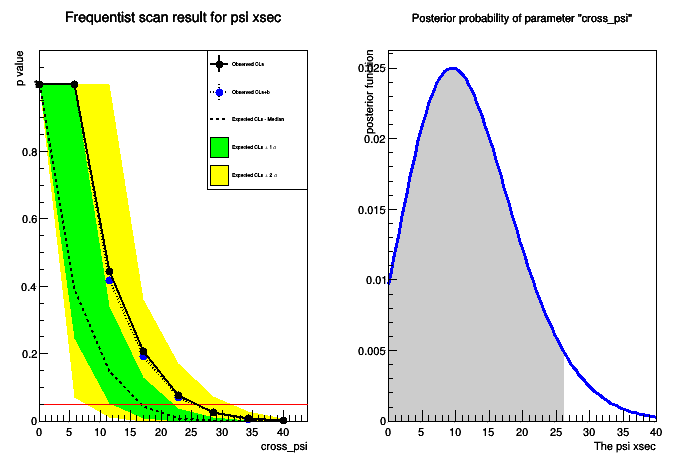
- Part 1: compute a CLs, modified frequentist upper limit.
The computation is based on toy Monte Carlos that allow to compute
confidence levels for s+b and b hypotheses. This requires the interplay
of different RooStats classes: FrequentistCalculator, which is initialized taking as input the two PDF models (background only, signal plus background), HypoTestInverter, which, for a given calculator (a FrequentistCalculator in this case) computes the confidence interval and returns it as a HypoTestInverterResult object. In the computation, the profile-likelihood test statistics (via the ProfileLikelihoodTestStat class) is passed to the "sampler" (ToyMCSampler) present in the "calculator" object.
#First example is with a frequentist approach
fc = ROOT.RooStats.FrequentistCalculator(ws.data("data"), bModel, sbModel)
fc.SetToys(2500,1500)

#Create hypotest inverter passing the desired calculator
calc = ROOT.RooStats.HypoTestInverter(fc)

#set confidence level (e.g. 95% upper limits)
calc.SetConfidenceLevel(0.95)

#use CLs
calc.UseCLs(1)

#reduce the noise
calc.SetVerbose(0)

#Configure ToyMC Sampler
toymcs = calc.GetHypoTestCalculator().GetTestStatSampler()

#Use profile likelihood as test statistics
profll = ROOT.RooStats.ProfileLikelihoodTestStat(sbModel.GetPdf())

#for CLs (bounded intervals) use one-sided profile likelihood
profll.SetOneSided(1)

#set the test statistic to use for toys
toymcs.SetTestStatistic(profll)

npoints = 8 #Number of points to scan
# min and max for the scan (better to choose smaller intervals)
poimin = poi.find("cross_psi").getMin()
poimax = poi.find("cross_psi").getMax()

print "Doing a fixed scan  in interval : ", poimin, " , ", poimax
calc.SetFixedScan(npoints,poimin,poimax);

result = calc.GetInterval() #This is a HypoTestInveter class object
upperLimit = result.UpperLimit()
- Part 2: compute a Bayesian upper limit: this part is simple, since no HypoTestInverter is needed. The upper limit is just given by the posterior Bayesian PDF obtained by the BayesianCalculator. The Bayesian calculator returns a SimpleInterval
#Example using the BayesianCalculator
#Now we also need to specify a prior in the ModelConfig
#To be quicker, we'll use the PDF factory facility of RooWorkspace
#Careful! For simplicity, we are using a flat prior, but this doesn't mean it's the best choice!
ws.factory("Uniform::prior(cross_psi)")
sbModel.SetPriorPdf(ws.pdf("prior"))

#Construct the bayesian calculator
bc = ROOT.RooStats.BayesianCalculator(ws.data("data"), sbModel)
bc.SetConfidenceLevel(0.95)
bc.SetLeftSideTailFraction(0.) # for upper limit

bcInterval = bc.GetInterval()
- Now print the results of the two methods:
#Now let's print the result of the two methods
#First the CLs
print "################"
print "The observed CLs upper limit is: ", upperLimit

#Compute expected limit
print "Expected upper limits, using the B (alternate) model : "
print " expected limit (median) ", result.GetExpectedUpperLimit(0)
print " expected limit (-1 sig) ", result.GetExpectedUpperLimit(-1)
print " expected limit (+1 sig) ", result.GetExpectedUpperLimit(1)
print "################"

#Now let's see what the bayesian limit is
print "Bayesian upper limit on cross_psi = ", bcInterval.UpperLimit()
- Plot the results of the two methods:
#Plot now the result of the scan

#First the CLs
freq_plot = ROOT.RooStats.HypoTestInverterPlot("HTI_Result_Plot","Frequentist scan result for psi xsec",result)
#Then the Bayesian posterior
bc_plot = bc.GetPosteriorPlot()

#Plot in a new canvas with style
dataCanvas = ROOT.TCanvas("dataCanvas")
dataCanvas.Divide(2,1)
dataCanvas.SetLogy(0)
dataCanvas.cd(1)
freq_plot.Draw("2CL")
dataCanvas.cd(2)
bc_plot.Draw()
dataCanvas.SaveAs("exercise_2.png")
- Pay attention at the actual numbers printed (remember, the meaning of the upper limit is very different in the two approaches!)
- The plot will look like the following:
The complete exercise is available below:
Exercise #3: measure the cross section with full statistics
- First of all, obtain the full statistics sample for the 2010 CMS data:
wget http://pellicci.web.cern.ch/pellicci/DataSet.root
- Return to the program exercise_0.py, and modify it to read the new file. Rerun the program, this will create a new workspace containing the data and the fit for the full statistics
- Remember: change the luminosity to the value of the full 2010 CMS statistics: 37 pb-1
- Then rerun exercise_1.py and notice the significance of the excess with full statistics. Congratulations, you're in the '70s!
- Create a new program exercise_3.py that imports the workspace, as in the previous exercises. As before, declare a few parameters constants to speed up the computing (you would probably not do that normally):
import ROOT

#Open the rootfile and get the workspace from the exercise_0
fInput = ROOT.TFile("Workspace_mumufit.root")
ws = fInput.Get("ws")
ws.Print()

#You can set constant parameters that are known
#If you leave them floating, the fit procedure will determine their uncertainty
ws.var("meanJpsi").setConstant(1)
ws.var("sigmaJpsi").setConstant(1)
ws.var("alphaJpsi").setConstant(1)
ws.var("nJpsi").setConstant(1)
ws.var("NJpsi").setConstant(1)
ws.var("meanpsi2S").setConstant(1)
ws.var("Nbkg").setConstant(1)
ws.var("a1").setConstant(1)
ws.var("a2").setConstant(1)
ws.var("a3").setConstant(1)

#Let the model know what is the parameter of interest
cross_psi = ws.var("cross_psi")
cross_psi.setRange(4., 16.)  #this is mostly for plotting reasons
poi = ROOT.RooArgSet(cross_psi)
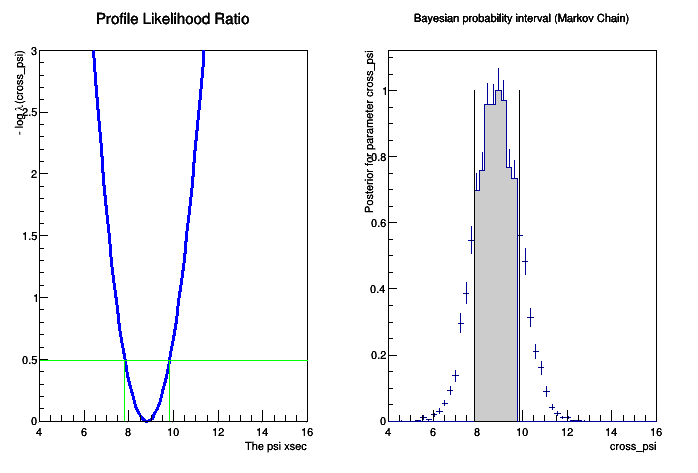
- Now, set the ModelConfig and cross_psi as parameter of interest (poi). Also, now we want 68 percent intervals:
#Configure the model
model = ROOT.RooStats.ModelConfig()
model.SetWorkspace(ws)
model.SetPdf("totPDF")
model.SetParametersOfInterest(poi)

#Set confidence level
confidenceLevel = 0.68
- The computation of the 68 percent confidence interval is performed using the ProfileLikelihoodCalculator:
#Build the profile likelihood calculator
plc = ROOT.RooStats.ProfileLikelihoodCalculator()
plc.SetData(ws.data("data"))
plc.SetModel(model)
plc.SetParameters(poi)
plc.SetConfidenceLevel(confidenceLevel)

#Get the interval
pl_Interval = plc.GetInterval()
- As alternative method, a probability interval can be computed using a Bayesian method. While using the Bayesian calculator would be perfectly correct, in this example with high statistics the integration part of the method would require a really long time. On the other hand, one can use the RooStats Markov Chain MC implementation to speed things up:
#Now let's determine the Bayesian probability interval
#We could use the standard Bayesian Calculator, but this would be very slow for the integration
#So we profit of the Markov-Chain MC capabilities of RooStats to speed things up

mcmc = ROOT.RooStats.MCMCCalculator(ws.data("data") , model)
mcmc.SetConfidenceLevel(confidenceLevel)
mcmc.SetNumIters(20000)           #Metropolis-Hastings algorithm iterations
mcmc.SetNumBurnInSteps(100)       #first N steps to be ignored as burn-in
mcmc.SetLeftSideTailFraction(0.5) #for central interval

MCMC_interval = mcmc.GetInterval()
- Finally, plots for both methods can be produced:
#Let's make a plot
dataCanvas = ROOT.TCanvas("dataCanvas")
dataCanvas.Divide(2,1)

dataCanvas.cd(1)
plot_Interval = ROOT.RooStats.LikelihoodIntervalPlot(pl_Interval)
plot_Interval.SetTitle("Profile Likelihood Ratio")
plot_Interval.SetMaximum(3.)
plot_Interval.Draw()

dataCanvas.cd(2)
plot_MCMC = ROOT.RooStats.MCMCIntervalPlot(MCMC_interval)
plot_MCMC.SetTitle("Bayesian probability interval (Markov Chain)")
plot_MCMC.Draw()

dataCanvas.SaveAs("exercise_3.png")
- And one can print the intervals determined by the two methods:
#Now print the interval for mH for the two methods
print "PLC interval is [", pl_Interval.LowerLimit(cross_psi), ", ", pl_Interval.UpperLimit(cross_psi), "]"

print "Bayesian interval is [", MCMC_interval.LowerLimit(cross_psi), ", ", MCMC_interval.UpperLimit(cross_psi), "]"

#PyROOT sometimes fails cleaning memory, this helps
del plc
- The plot will look like this:
The complete exercise is available here:
--
- 2018-12-17

| I | Attachment | History | Action | Size | Date | Who | Comment |
|---|---|---|---|---|---|---|---|
| |
CMSDAS_Stat_2019.pdf | r1 | manage | 2886.8 K | 2019-01-28 - 10:43 | Slides to support the exercises | |
| |
DataSet.root | r1 | manage | 127.1 K | 2018-12-17 - 11:07 | Full 2010 statistics dataset for the dimuon mass distribution | |
| |
DataSet_lowstat.root | r1 | manage | 9.9 K | 2018-12-17 - 11:07 | Low statistics CMS dataset for the dimuon mass distribution | |
| |
Data_lowstat.png | r1 | manage | 13.0 K | 2018-12-17 - 11:08 | Low statistics data for the dimuon mass spectrum | |
| |
exercise_0.png | r1 | manage | 14.0 K | 2018-12-17 - 11:08 | Fit to the low statistics dimuon mass spectrum | |
| |
exercise_0.py.txt | r2 r1 | manage | 3.5 K | 2019-01-28 - 09:31 | Exercise 0: fit the dimuon invariant mass spectrum | |
| |
exercise_1.py.txt | r1 | manage | 1.3 K | 2018-12-17 - 11:21 | Exercise 1: calculate the statistical significance of the excess | |
| |
exercise_2.png | r1 | manage | 17.0 K | 2018-12-17 - 11:29 | Comparison of different upper limit calculations | |
| |
exercise_2.py.txt | r2 r1 | manage | 3.8 K | 2018-12-17 - 11:47 | Exercise 2: determine the upper limit on Nsig in the low statistics case | |
| |
exercise_3.png | r1 | manage | 12.6 K | 2018-12-17 - 14:03 | Intervals on the psi cross section | |
| |
exercise_3.py.txt | r1 | manage | 2.5 K | 2018-12-17 - 14:03 | Exercise 3: determine the interval on the psi cross section with full stat |

 |
|
Ideas, requests, problems regarding TWiki? Send feedback